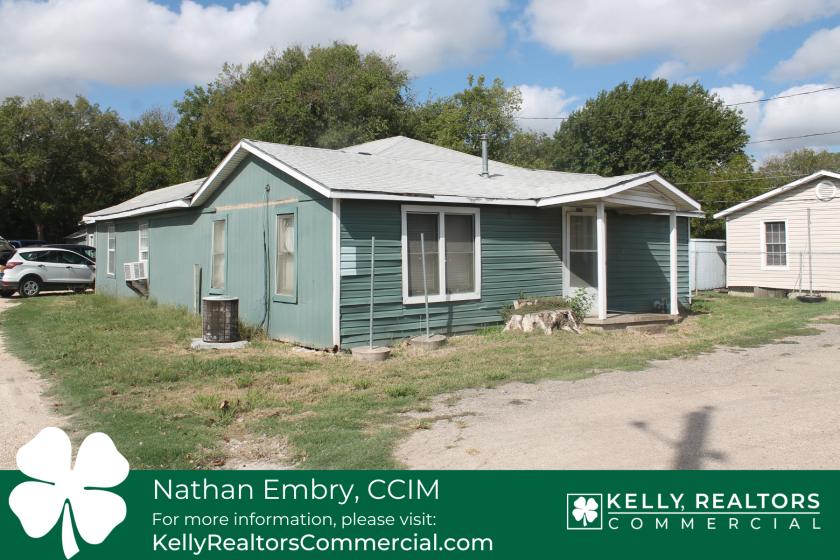
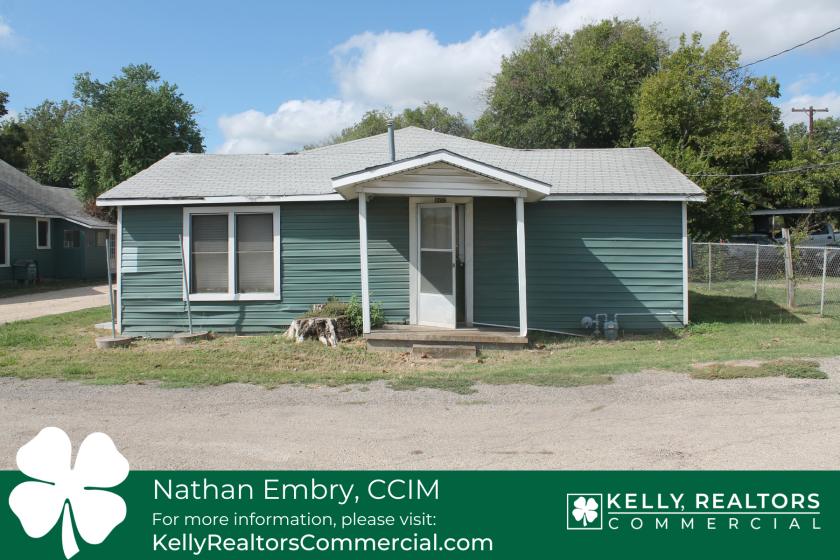
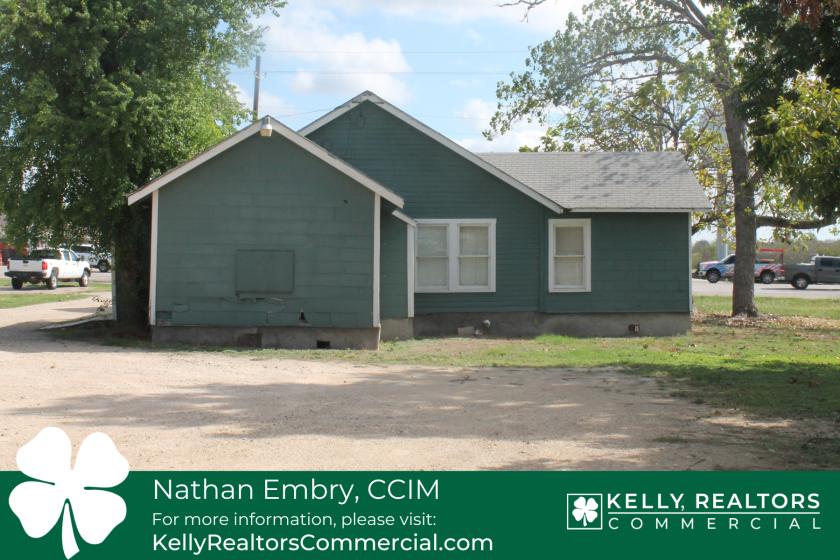
800 and 802 Robinson Drive
Robinson, TX 76706
Listing ID: 307440
- Property Type Retail : Free Standing Building
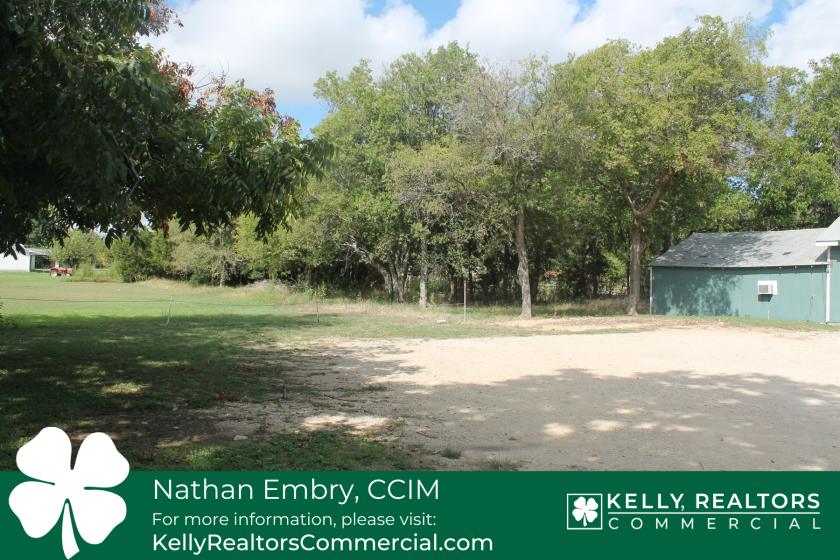
- Lot Size Acres 0.850
- Building Sq Ft 5,667
- Building Price per Sq Ft $60.00
- Land Sq Ft 37,026
- Land Price per Sq Ft $9.18
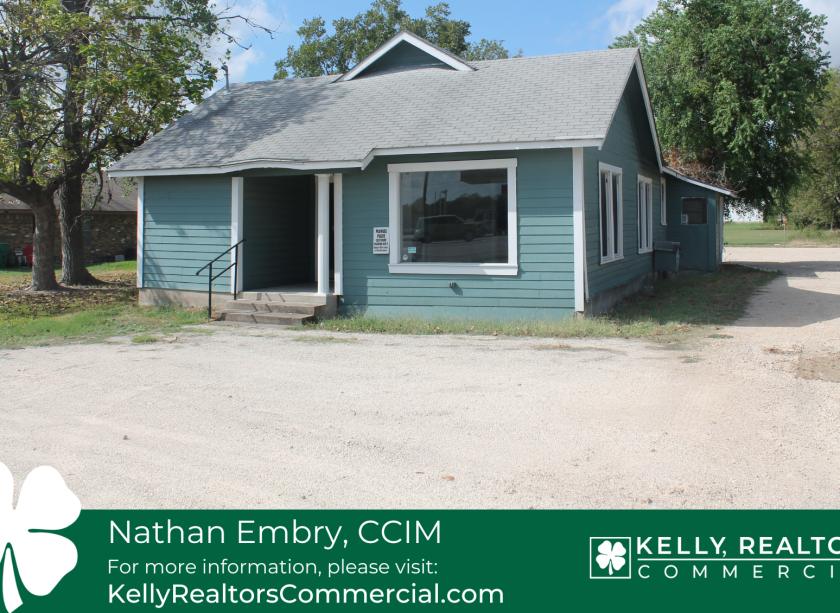
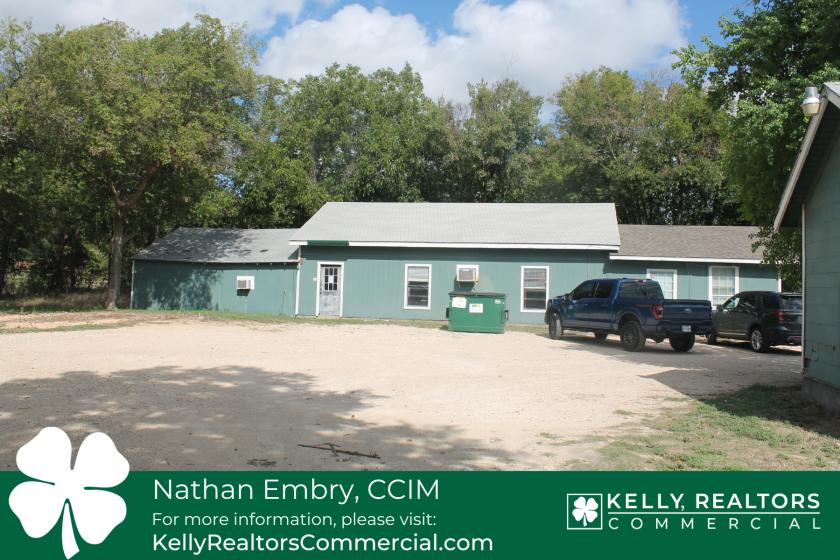

Property Highlights
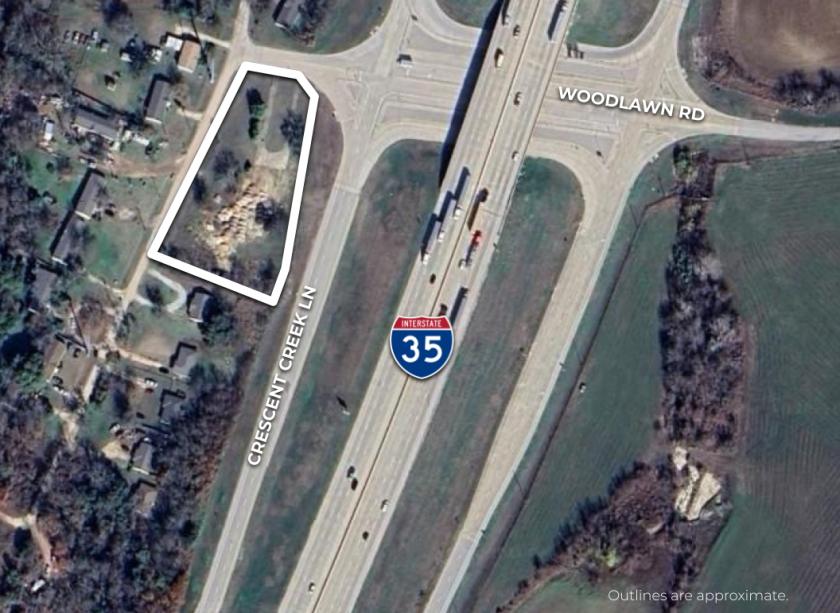
• Convenient Location near IH 35 & Loop 340
• Approx. 131 feet of Highway 77 Frontage
• Robinson ISD
• Excellent Visibility and depth
• No Flood Zone
• Neighbors Include: Ferrellgas, Marco’s Pizza, Robinson Quick Lube, Tejun, Bush’s Chicken, and many more
Attachments & Files
Listing Demographics
Information based on the most recently available data (updated annually) and is provided in 1-mile, 3-mile, and 5-mile radii (radiuses) of the property location.
| 1-Mile | 3-Miles | 5-Miles | ||
|---|---|---|---|---|
| Total Population | 4,184 | 28,932 | 89,506 | |
| Population Median Age | 36 | 34 | 33 | |
| Population by Age | 0-9 Yrs | 561 (13%) | 4090 (14%) | 11706 (13%) |
| 10-19 Yrs | 685 (16%) | 4484 (15%) | 15127 (16%) | |
| 20-29 Yrs | 635 (15%) | 6391 (22%) | 22605 (25%) | |
| 30-39 Yrs | 513 (12%) | 3482 (12%) | 10443 (11%) | |
| 40-49 Yrs | 526 (12%) | 2834 (9%) | 8413 (9%) | |
| 50-59 Yrs | 439 (10%) | 3139 (10%) | 8397 (9%) | |
| 60-69 Yrs | 459 (10%) | 2494 (8%) | 7000 (7%) | |
| 70+ Yrs | 365 (8%) | 2017 (6%) | 5815 (6%) | |
| Median HH Income | $60,907 | $46,463 | $38,331 | |
| Total Household Income | < 24K | 256 (18%) | 2105 (21%) | 10554 (33%) |
| 25-49K | 316 (22%) | 3073 (31%) | 8807 (28%) | |
| 50-74K | 263 (19%) | 1766 (18%) | 4688 (14%) | |
| 75-99K | 185 (13%) | 1091 (11%) | 2907 (9%) | |
| 100-199K | 293 (21%) | 1421 (14%) | 3736 (11%) | |
| 200K+ | 65 (4%) | 208 (2%) | 600 (1%) | |
| Highest Education Level | No Diploma | 258 | 3466 | 9098 |
| Diploma or GED | 944 | 5249 | 13556 | |
| Some College | 513 | 3433 | 10288 | |
| Assoc. Degree | 397 | 1605 | 4218 | |
| Bachelors Degree | 282 | 1591 | 6353 | |
| Higher Degree | 136 | 1091 | 3733 | |
| Total Housing Units | 1,487 | 10,633 | 35,991 | |
| --Owner-Occupied | 1,060 | 5,610 | 13,627 | |
| --Renter-Occupied | 320 | 4,054 | 17,666 | |
| Owner-Occupied Values | < 100K | 303 | 2895 | 6325 |
| 100-199K | 562 | 1774 | 4869 | |
| 200-299K | 155 | 723 | 1744 | |
| 300-399K | 17 | 109 | 317 | |
| 400-499K | 11 | 67 | 159 | |
| 500K+ | 12 | 42 | 212 | |
| Total Working Age Population | 3,228 | 22,060 | 70,910 | |
| In Work Force | 2,065 | 14,299 | 43,052 | |
| Not In Work Force | 1,163 | 7,761 | 27,858 | |
| Workforce Employed | 1,873 | 13,545 | 40,612 | |
| Workforce Unemployed | 192 | 746 | 2,367 | |
| Civlian Workforce | 2,065 | 14,290 | 42,979 | |
| Military Workforce | 0 | 9 | 74 | |
| Total Households | 1,380 | 9,664 | 31,293 | |
| Family Households | 1,038 | 6,497 | 18,136 | |
| Non-Family Households | 342 | 3,167 | 13,157 | |
| Married Couple | 729 | 4,039 | 11,468 | |
| Other Family | 309 | 2,458 | 6,669 | |
| Married w/Child | 394 | 1,799 | 4,928 | |
| Single Male w/Child | 27 | 220 | 620 | |
| Single Female w/Child | 62 | 1,038 | 3,059 | |
Population Change Last Two Decades - Plus Projection
| 2000 | % | 2010 | % | 2020 | % | 2030 | |
|---|---|---|---|---|---|---|---|
| Texas | 20,851,820 | +21 | 25,145,561 | +18 | 29,677,668 | +18 | 34,894,452 |
| McLennan County | 213,517 | +10 | 234,906 | +8 | 253,066 | +6 | 269,381 |
No part of this information may be copied, reproduced, repurposed, or screen-captured for any commercial purpose without prior written authorization from MyEListing.
While we strive to provide the most accurate information, all listing information, and demographic data, is provided by third-parties. As such, MyEListing will not be responsible for the accuracy of the information. It is strongly recommended that you verify all information with the listing agent, and any relevant agencies, prior to making any decisions.
Listing Location & Map Views
Listing Agent

More listings from Nathan Embry


Featured Vendors